
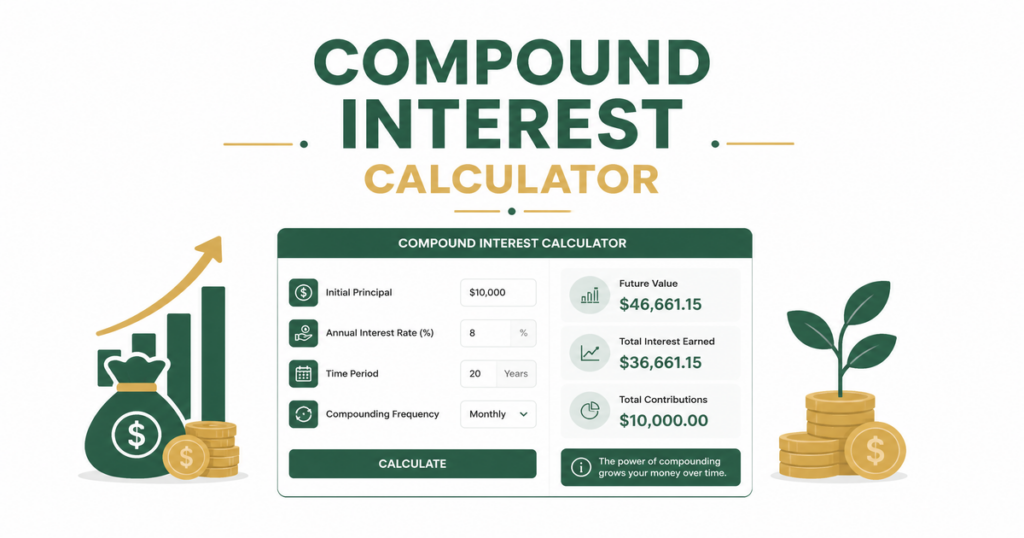
Compound Interest Calculator
See how savings or investments grow with compounding. Optional monthly SIP added at end of each period.
Use the calculator above to see how savings or investments grow with compounding. Enter a starting amount, optional monthly contribution (SIP), expected annual return, time horizon, and compounding frequency. The tool shows future value, total contributed, and estimated gains—the difference between what you put in and what you end up with.
What is compound interest?
Compound interest means you earn returns not only on your original principal but also on accumulated gains from previous periods. Over long horizons, compounding is the main engine of wealth building—small regular investments can grow into substantial corpus amounts.
Simple interest pays only on principal. Compound interest pays on principal plus prior interest—so growth accelerates over time. That is why starting a ₹5,000/month SIP at age 25 often beats a larger lump sum started at 40.
How this calculator works
The future value of a lump sum with periodic compounding:
FV (principal) = P × (1 + r)n
Where P is starting amount, r is rate per compounding period, and n is number of periods.
For regular monthly contributions (SIP), the calculator adds the future value of an annuity at the same compounding frequency:
FV (SIP) ≈ PMT × ((1 + r)n − 1) ÷ r
Total contributed = Starting amount + (Monthly SIP × 12 × Years)
Estimated gains = Combined future value − Total contributed
Compounding frequency matters
| Frequency | Typical use |
|---|---|
| Monthly | Mutual fund SIPs, many savings products |
| Quarterly | Some FDs and legacy products |
| Annually | Simple illustrations; some bonds |
More frequent compounding slightly increases effective yield at the same nominal rate. For monthly SIPs, select Monthly compounding for the closest approximation.
Worked example (India)
Starting amount: ₹1,00,000 | Monthly SIP: ₹5,000 | Return: 12% p.a. | Time: 10 years | Compounding: Monthly
- Total contributed = ₹1,00,000 + (₹5,000 × 120) = ₹7,00,000
- Future value ≈ ₹13–14 lakh (run exact figure in calculator above)
- Estimated gains ≈ ₹6–7 lakh from compounding—not guaranteed; actual mutual fund returns vary year to year
Notice how gains can exceed total contributions over a decade at reasonable return assumptions—that is compounding at work.
Rule of 72 — quick mental math
Divide 72 by your annual return % to estimate years to double your money:
- At 12% → money doubles in ~6 years
- At 8% → ~9 years
- At 6% (inflation-like) → ~12 years
Use this for rough planning; the calculator above gives precise figures for lump sum + SIP combinations.
Real returns after inflation
Nominal 12% return with 6% inflation ≈ 6% real return. Long-term goals (retirement, child education) should use inflation-adjusted thinking—see our article on inflation and real returns.
A ₹1 crore goal in 20 years is not the same as ₹1 crore today. Either inflate your target or use a real (post-inflation) return in planning tools.
Compound interest vs debt — opposite forces
Compound interest works for you in investments and against you on credit card debt at 36–42% APR. Paying off high-interest debt often “returns” more than markets guarantee. Clear expensive debt before maximizing equity exposure—model both sides with our debt payoff calculator.
Practical tips for investors in India
- Start SIPs early; time in market beats timing the market for most salaried investors.
- Increase SIP by 5–10% each year with salary hikes—boosts corpus without feeling a lump-sum pinch.
- Equity returns are not fixed at 12%; use conservative (8–10%) and optimistic (12–14%) scenarios.
- Keep an emergency fund so you never redeem equity at a loss for short-term needs.
Frequently asked questions
Is 12% return guaranteed on mutual funds?
No. Equity mutual funds can lose 20–40% in bad years. 12% is a long-term illustration used in many planning examples—not a promise. Past performance does not guarantee future results.
SIP vs lump sum — which is better?
Lump sum wins mathematically if markets rise steadily; SIP reduces timing risk and suits monthly salaried cash flow. Read SIP vs lump sum for a full comparison.
Does this include tax on gains?
No. LTCG/STCG rules on equity and debt funds change over time. Treat calculator output as pre-tax illustration.
Related reading
- Power of compound interest — full guide to long-term wealth building
- How to start investing — first steps for beginners in India
- Emergency fund calculator — protect compounding from forced redemptions
Disclaimer: Projections assume constant returns and regular contributions. Markets fluctuate. Educational content only—not investment advice. Consult a SEBI-registered adviser for personalized guidance.